A mod_gearman chart


mod_gearman_diagram


Some thoughs on mod_gearman benefits.

  • It calls back  Gearmand, so it can be fitted in a vlan behind a firewall and you do not have to open any ports towards the vlan;
  • You can have more than one worker to monitor a host or service. They share the load, so you have a round robin balancing and if one faints, the others take all the checks and execute them. So, you have an easy way to  redundancy for the workers.

In this chart I “collapsed” the gearmand daemon under the  “Monitor” box.

Nagios notification escalations made easy

Since someone asked in the nagios users mailing list for an help to understand how notification escalations work in Nagios, I wrote an easy and short workflow to explain the logic underneath.

Notification escalations are a means to ensure that someone will ne notified, eventually. If a contact doesn’t acknowledge a problem, we can escalate the nofications to someone else, changing the way we deliver the messages if we think it’s a good strategy.

In this post we won’t discuss of the syntax or the options regarding the escalations, we will have a look at the logic of the escalations, at how they take place and how they work.

Here the workflow for check/notification/escalation is the following:

  1. The service/host is checked in OK state with the check_interval timing;
  2. As the service/host goes into a NON OK state, but didn’t reach the max_check_attempts, the service enters a SOFT NON OK state and the next check is scheduled with the retry_interval timing;
  3. As the service/host in NON OK state reaches the max_check_attempts value, the service enters an HARD NON OK STATE and the next service/host check is scheduled with the check_interval timing;
  4. Now, if you set first_notification_delay, this can alter the timing for the first notification to be sent (0 means notifications to be sent immediately);
  5. If you didn’t set the first_notification_delay, the first notification is immediately sent and the following will be scheduled with the notification_interval timing (0 means only the first notification will be sent, the other will not be sent);

Now, let’s make a practical example:

define serviceescalation{
host_name               webserver
service_description     HTTP
first_notification      3
last_notification       5
notification_interval   45
contact_groups          ITOps_Oncall,managers
}
define serviceescalation{
host_name               webserver
service_description     HTTP
first_notification      6
last_notification       0
notification_interval   60
contact_groups	  ITOps_Oncall,managers,everyone
}

What happens? Here we go:

  1. In this escalation, at the third notification (with the notification_interval taking place), the notification interval changes to 45 minutes, so the first notification will be sent after the max_check_attempts value will be reached (assuming you didn’t put any delay), then the second after 10 time units, usually 10 minutes, the third 10 mins after the second, the fourth 45 mins after the third, the fifth 45 mins after the fourth, the sixth 45 mins after the fifth.
  2. From the sixth notification, the new escalation comes into play. The seventh notification will be sent after 60 minutes, and all the other notifications will be sent 60 mins after each other. Keep in mind that having used 0 as the last_notification value, you escalation will never end till your check will return an OK status.

Rilasciato check_bandwidth_snmp v.0.1

Oggi ho rilasciato il mio script per controllare con Nagios la banda di un qualsiasi apparato di rete che supporti SNMP v3. Solo dopo 1 anno dalla stesura dello script eh…

Ho dovuto abbellirlo e modificarlo, per renderlo “guardabile”. In questa operazione di revisione potrebbe essersi infilato qualche noioso baco. Ho provato il nuovo script e sembra funzionare, ma se trovaste degli errori, fatemelo sapere e vedremo cosa fare.

Ci sono, anche a prima vista, dei miglioramenti da fare, come per esempio un meccanismo di login più flessibile o un ciclo per il controllo delle variabili, ma se avessi atteso queste ulteriori modifiche, non avrei più reso disponibile lo script. Mi conosco. Casomai, le migliorie potranno essere oggetto di un secondo rilascio, se mai…

Lo trovate qui

MonitoringExchange

Corso su Nagios – Brainstorming Phase

Dato che il mio amichino Theo mi suggeriva che forse a qualcuno potrebbe interessare un tutorial su come installare e configurare Nagios, stavo pensando di iniziare un corso su Nagios articolato, per ora, nei seguenti step:

1. Avvicinamento. Cosa è Nagios, a cosa mi può servire, cosa fa;

2. Hands on. Prendiamo i sorgenti di Nagios, compiliamoli e installiamolo su un server. Partirò da una virtual machine Ubuntu Desktop pulita, indicandovi quali pacchetti o programmi o librerie accessorie installare e come farlo. Parto da una Destkop, tanto per non farvi ammattire;

3. Test the difference. Seconda macchina virtuale. Questa sarà il client Ubuntu che terremo sotto controllo, su questa installeremo gli agenti e impareremo a configurarne il supporto SNMP;

4. Win on Win. Impareremo a installare, configurare e interrogare il clent Nsclient++, in modo da tenere sotto controllo anche le macchine Windows. Davvero pensavate che avrei ignorato Windows?

4. So confusing, so amazing. Giusto un po’ di teoria. I file principali di Nagios, la loro sintassi, il significato delle varie istruzioni. Questo punto richiederà probabilmente una serie di puntate a parte;

5. Creiamo il nostro primo plugin. Si, si, giusto un paio di api, un po’ di bash, e si fa tutto. Imparerete a estendere Nagios oltre ogni vostra immaginazione. Ok, frase ad effetto ma rende l’idea.

6. Agentless! SNMP mon amour. Ok, vedremo come configurare Net-Snmp, come interrogarlo in maniera sicura, come gestire delle trap, insomma, come fare parecchie cose interessanti senza bisogno di installare un agente sulla macchina da tenere sotto controllo;

7.  GraphITe! Plottare Nagios. I dati di per sé sono nulla se non li aggreghi in qualche modo. Vedremo come generare dei grafici partendo dai dati recuperati da Nagios. Cosa useremo? Mah, io ho sempre utilizzato NagiosGrapher, ma anche Pnp4Nagios potrebbe andare bene;

8. Templare! Ok, non è una religione. Se i template base di NagiosGrapher non vi bastano, vedremo come crearne qualcuno a nostro piacimento, con tanto di legende, linee mediane e quant’altro.

9. Infighettiamoci. Beh, Nagvis fa sempre scena, vedremo come mettere Nagios sul palco e ben sotto i riflettori.

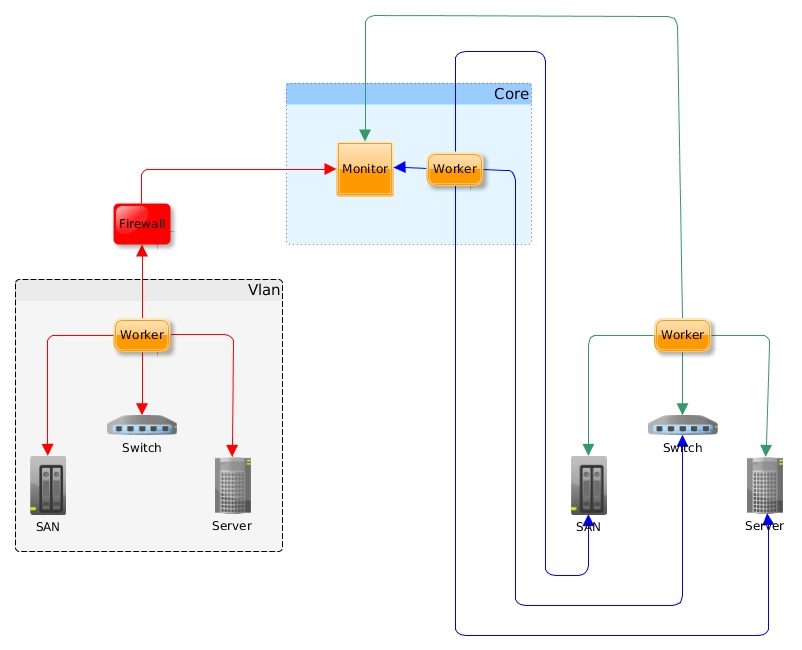
10. One step beyond! Ovvero della distribuzione. Qualcosa di più complicato? Per esempio Nagios in versione distribuita in modo da controllare ambienti molto complessi? Oppure Nagios in alta affidabilità?

Ok, mi sono giocato il prossimo anno di post.

Perché ho intitolato questo post “Brainstorming”? Perché se vi interessa, potete indicare nei commenti quali argomenti vorreste vedere trattati e quindi fornirmi qualche spunto nell’elaborazione dei prossimi post di questo corso.

Bon voyage…

Ah, giusto per dare un’idea…

Misurazione di Banda tramite SNMP e grafico su NagiosGrapher